Results on mixPred runs on GTEx V8 (performance comparison based on 10-fold and 2-fold CV)
rm(list = ls())
library(ggplot2)
theme_set(theme_bw(base_size = 15))
library(dplyr)
library(reshape2)
library(data.table)
options(datatable.fread.datatable = FALSE)
options(stringsAsFactors = FALSE)
source('../code/rlib_analysis.R')
datadir = '/Users/yanyul/Desktop/mixqtl-pipeline-results/postprocess-prediction'
cbPalette <- c('ascQTL' = "#999999", 'mixPred' = "#E69F00", 'trcQTL' = "#56B4E9", 'vanilla' = "#009E73", "#F0E442", "#0072B2", "#D55E00", "#CC79A7")
source('https://gist.githubusercontent.com/liangyy/43912b3ecab5d10c89f9d4b2669871c9/raw/8151c6fe70e3d4ee43d9ce340ecc0eb65172e616/my_ggplot_theme.R')
th$panel.border = element_rect(colour = th$axis.line$colour)
ifrun = FALSE
1 Analysis plan
Regress out covariates as usual on the full data. And split the data into 10-part or 2-part partitions. Run mixPred and nePred on each of the leave-one-part out data. And evaluate the performance on the held out one part of the data.
2 Load results
method_df = data.frame(method = c('mixpred', 'nepred'), tag = c('mixPred', 'vanilla'))
full_sample_size = 670
partitions = c(10, 2)
out = list()
for(part in partitions) {
  for(i in 1 : nrow(method_df)) {
    tmp_ = read.table(paste0(datadir, '/', 'Whole_Blood-x-indiv_partition-gtex_v8_whole_blood_partition_', part, '-performance-', method_df$method[i], '.txt.gz'), header = T, )
    out[[length(out) + 1]] = tmp_ %>% mutate(method = method_df$tag[i], split = part, sample_size = full_sample_size * (part - 1) / part)
  }
}
df = do.call(rbind, out)
3 Plot Pearson correlation comparison
Median correlation across partitions.
p = df %>% group_by(gene, method, sample_size) %>% summarize(pearson = median(pearson_correlation)) %>% select(gene, pearson, method, sample_size) %>% dcast(gene + sample_size ~ method, value.var = 'pearson') %>% ggplot(aes(x = vanilla, y = mixPred)) + geom_point(alpha = .3) + geom_density2d(color = 'gray') + geom_abline(slope = 1, intercept = 0, color = 'gray') + facet_wrap(~sample_size, labeller = label_both) + th + coord_equal()## Warning in dcast(., gene + sample_size ~ method, value.var = "pearson"): The dcast generic in data.table
## has been passed a grouped_df and will attempt to redirect to the reshape2::dcast; please note that
## reshape2 is deprecated, and this redirection is now deprecated as well. Please do this redirection
## yourself like reshape2::dcast(.). In the next version, this warning will become an error.p 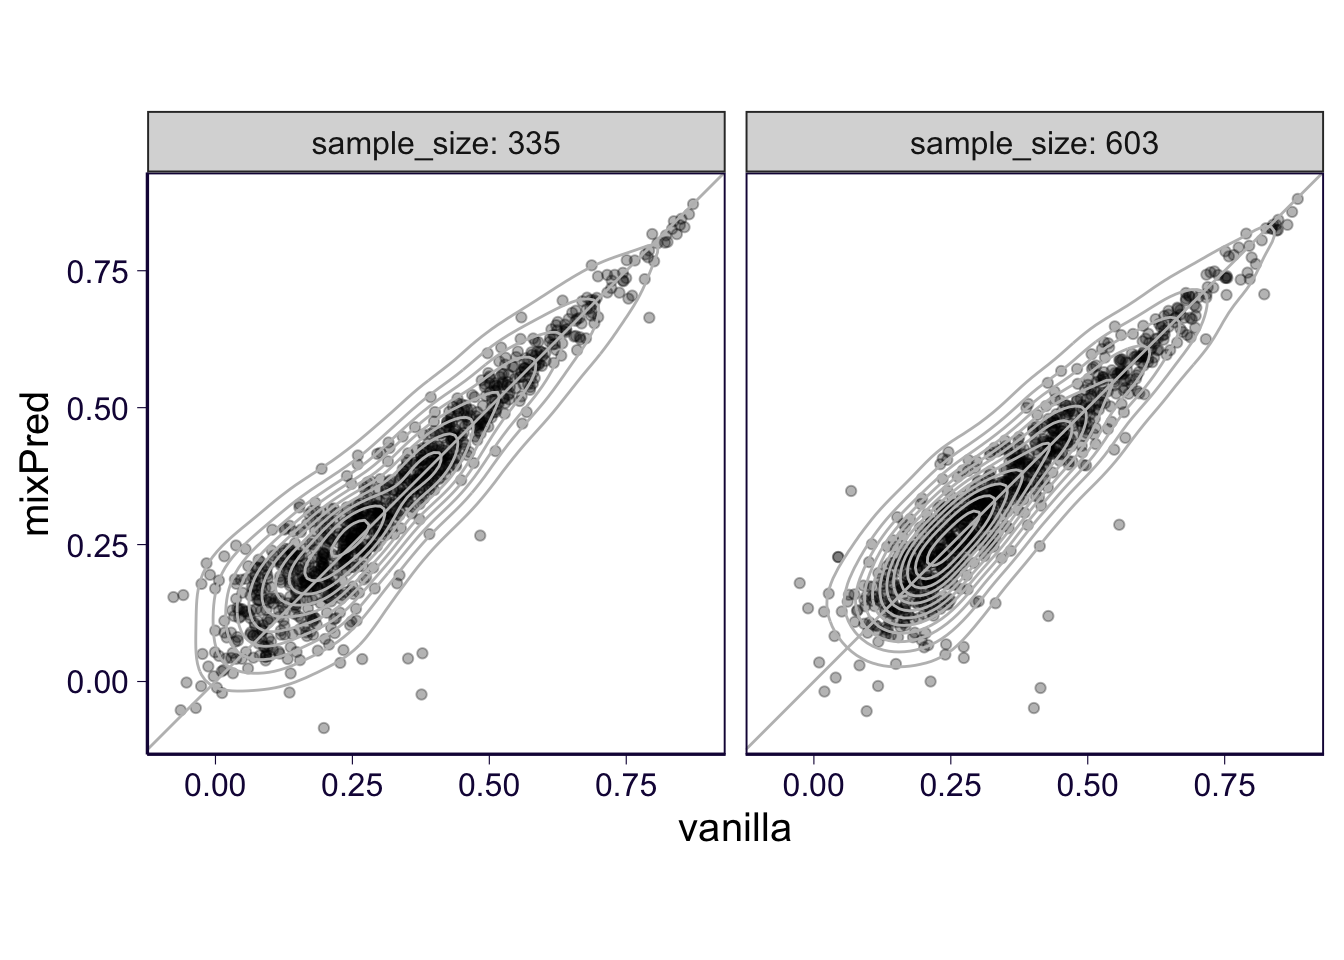
ggsave(filename = '../output/gtex-v8-pipeline-mixpred-with-gene-qc-pearson.png', height = 4, width = 7)All pairwise comparison.
df %>% select(gene, pearson_correlation, method, partition, sample_size) %>% dcast(gene + partition + sample_size ~ method , value.var = 'pearson_correlation') %>% ggplot(aes(x = vanilla, y = mixPred)) + geom_point(alpha = .2) + geom_density2d(color = 'gray') + geom_abline(slope = 1, intercept = 0, color = 'gray') + facet_wrap(~sample_size, labeller = label_both) + th + coord_equal()## Warning in dcast(., gene + partition + sample_size ~ method, value.var = "pearson_correlation"):
## The dcast generic in data.table has been passed a data.frame and will attempt to redirect to the
## reshape2::dcast; please note that reshape2 is deprecated, and this redirection is now deprecated as
## well. Please do this redirection yourself like reshape2::dcast(.). In the next version, this warning
## will become an error.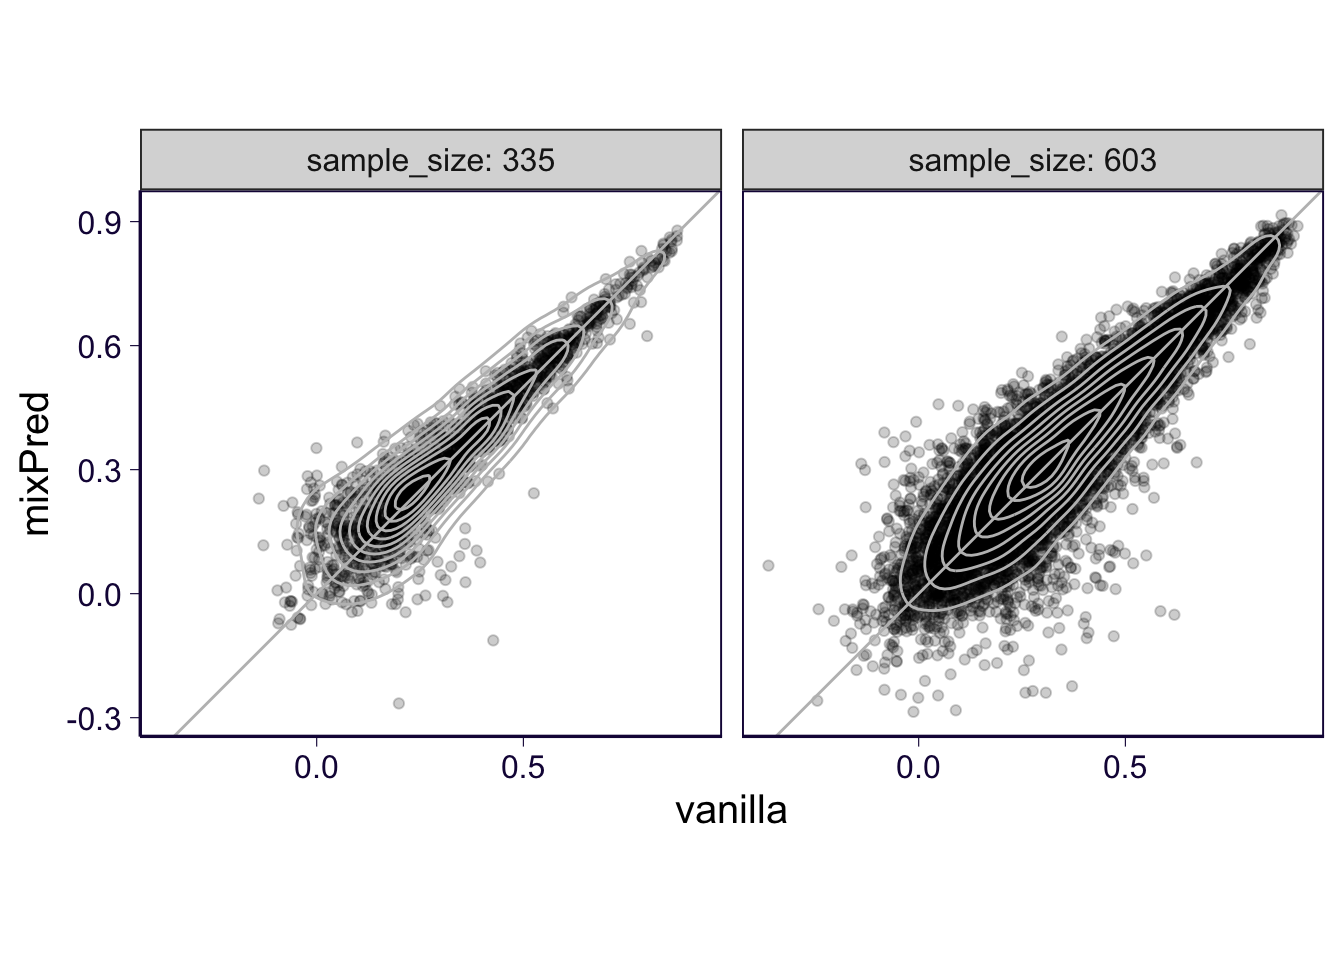
As violin plot.
p = df %>% select(gene, pearson_correlation, method, partition, sample_size) %>% ggplot(aes(x = method, y = pearson_correlation, fill = method)) + geom_violin() + geom_boxplot(width = .4) + facet_wrap(~sample_size, labeller = label_both) + th + scale_fill_manual(values = cbPalette) + theme(legend.position = 'bottom')
p 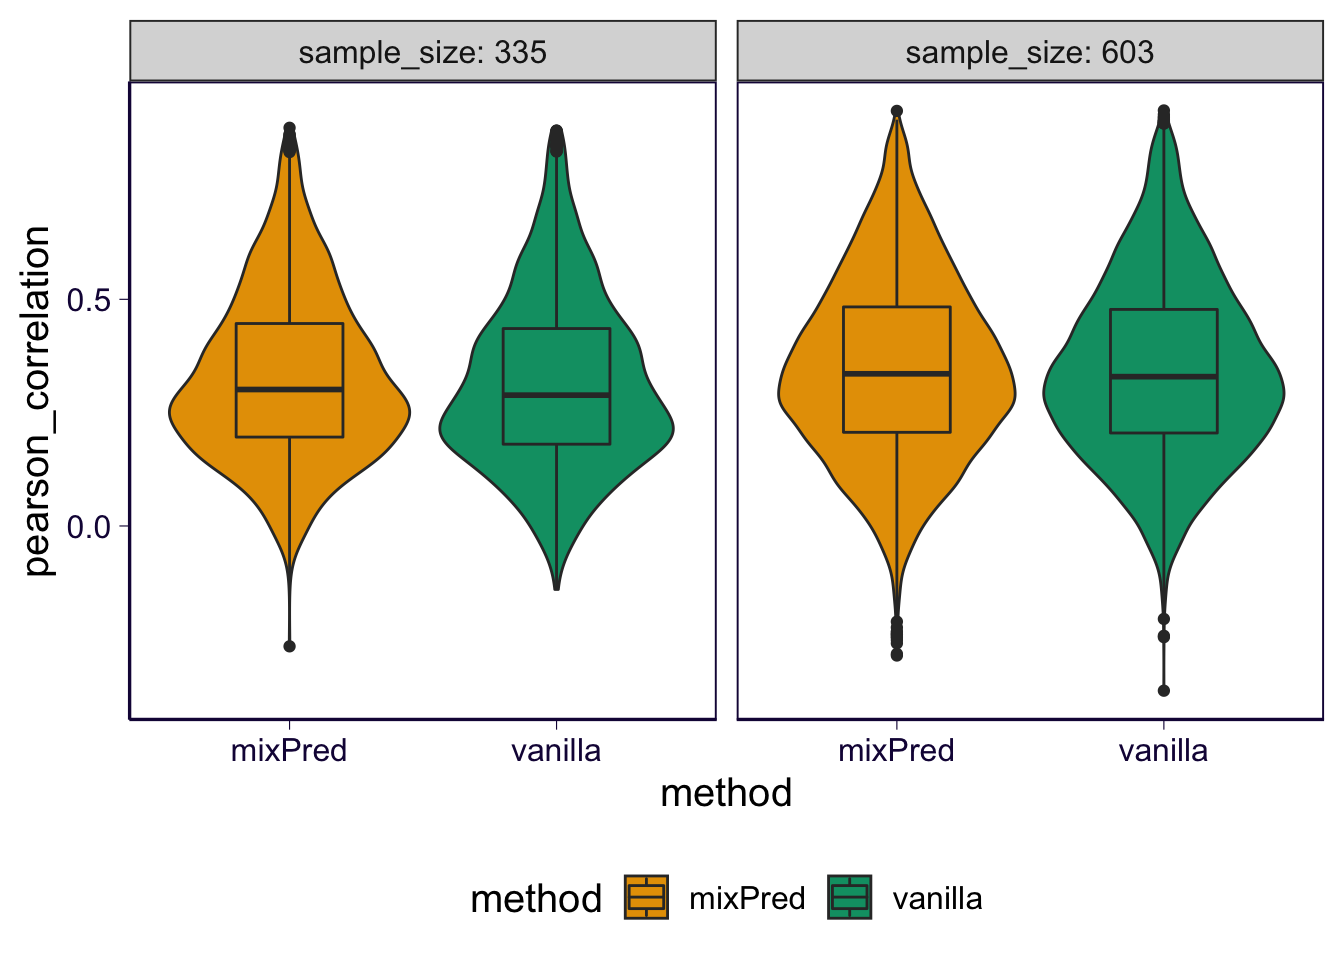
ggsave(filename = '../output/gtex-v8-pipeline-mixpred-with-gene-qc-pearson-violin.png', height = 4, width = 7)Sample size comparison: 670 * 0.9 vs 670 * 0.5
# two_cols = as.character(unique(df$sample_size))
p = df %>% select(gene, pearson_correlation, method, partition, sample_size) %>% mutate(sample_size = paste('sample size =', sample_size)) %>% group_by(gene, sample_size, method) %>% summarize(pearson = median(pearson_correlation)) %>% dcast(gene + method ~ sample_size, value.var = 'pearson') %>% ggplot(aes(x = `sample size = 335`, y = `sample size = 603`)) + geom_point(alpha = .2) + geom_density2d(color = 'gray') + geom_abline(slope = 1, intercept = 0, color = 'gray') + facet_wrap(~method) + th
## Warning in dcast(., gene + method ~ sample_size, value.var = "pearson"): The dcast generic in data.table
## has been passed a grouped_df and will attempt to redirect to the reshape2::dcast; please note that
## reshape2 is deprecated, and this redirection is now deprecated as well. Please do this redirection
## yourself like reshape2::dcast(.). In the next version, this warning will become an error.p 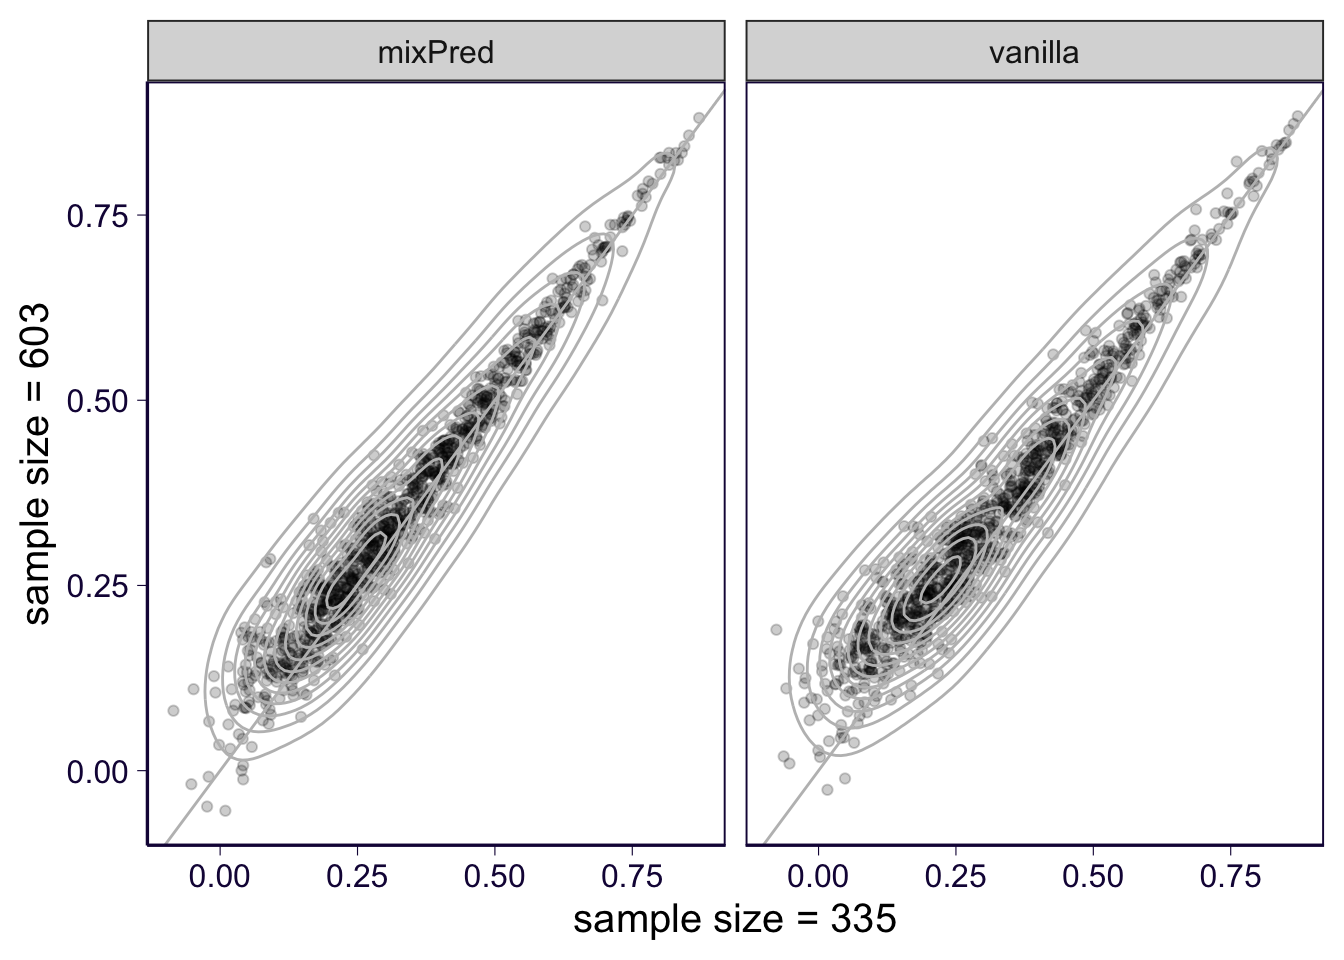
ggsave(filename = '../output/gtex-v8-pipeline-mixpred-with-gene-qc-pearson-2.png', height = 4, width = 7)